
Issue
The following SAP HANA alert is issued:
Alert 46: Runtime dump files
The SAP HANA database has generated out-of-memory (OOM) trace files in the trace directory (/usr/sap/
Example for an actual file name:
indexserver_saphana1.39503.rtedump.72290.oom.trc
In HANA DB Studio, on the Diagnosis Files tab, you find trace files when entering the filter string 'oom' or 'rtedump' and sort by the Modified column.
Files with a name containing 'composite_oom' are linked to the statement memory limit. ("Is it possible to limit the memory that can be allocated by a single SQL statement?") for more details. These files don't indicate overall OOM situations but a high statement-specific memory consumption. This scenario is not discussed in detail in this SAP Note. Normally the analysis is quite straight-forward because it is already clear which activity ran into the memory limit.
Environment
SAP HANA 1.0 or 2.0
Cause
The memory requirements of SAP HANA exceed the available memory resources. When SAP HANA requires additional memory and is not able to allocate new memory or reclaim memory otherwise, an out-of memory (OOM) dump is generated and the action is terminated.
This is useful if you suffer from an unusual high memory utilization and can be triggered independent of actual OOM situations.
Solution
In the following you can find the usual steps that are required to analyze an OOM dump file. The OOM dump file contains information about allocated memory and limitations that can be evaluated to understand the root causes of high memory consumption and OOM dumps.
If multiple OOM dump files are generated you should start with analyzing the indexserver dump file, because in most cases the indexserver is responsible for the highest memory consumption.
If you use the Diagnosis Files tab in SAP HANA Studio you have to make sure that the complete file is displayed (“Show Entire File”), otherwise some information can be missing.
The dump file typically contains the following sections that contain useful information for analyzing OOM issues:
[BUILD] Build information
[THREADS] Running threads
[STACK_SHORT] Short call stacks and pending exceptions of all threads
[PROCESS_INFO] Process information
[OS_MEMORY] Operating system information about memory
[MEMORY_OOM] Information about current out of memory situation
[STAT] Statistical data
You can use following steps in order to analyze the OOM dump file and understand the memory situation in a better way.
1. Collection of general information
In the [BUILD] section you can look for the SAP HANA version and note it down.
Example:
Version : 2.00.10.00.386119 (NewDB100_REL)
Go to the [MEMORY_OOM] section and note the time stamp when the OOM situation occurred.
Example:
Information about current out of memory situation: (2019-08-24 20:48:12 161 Local)
2. Collection of general memory information
In the [MEMORY_OOM] section you can find the number of bytes that couldn’t be allocated and resulted in the OOM situation:
Example:
Failed to allocate 6599993600 byte.
In the [MEMORY_OOM] under IPMM short info you find information about the GLOBAL_ALLOCATION_LIMIT (GAL), SHARED_MEMORY, and CODE_SIZE. Shared memory is mainly related to the row store.
Example:
GLOBAL_ALLOCATION_LIMIT (GAL) = 368301238272b (349.87gb), SHARED_MEMORY = 97323194912b (91.32gb), CODE_SIZE = 6053733888b (5.56gb)
In the [MEMORY_OOM] section you can also find a list of all services including the corresponding process allocation limits (PAL), allocated bytes (AB) and used bytes (U). An AB value that is significantly larger than a U value doesn’t necessarily mean a problem: If necessary, allocated, but not used memory will be released. The following constellations can be considered to understand the OOM memory situation:

In most cases the heap area is responsible for OOM situations. Further analysis based on the output of M_HEAP_MEMORY in section [PROCESS_INFO] can be done in this case.
Example:
PID=155373 (hdbcompileserve), PAL=975919863398, AB=677236736, UA=0, U=375189520, FSL=0
PID=155005 (hdbnameserver), PAL=975919863398, AB=2438881280, UA=0, U=1929867760, FSL=0
PID=155370 (hdbpreprocessor), PAL=975919863398, AB=990150656, UA=0, U=516609034, FSL=0
PID=18542 (hdbxsengine), PAL=975919863398, AB=4085981184, UA=0, U=3433417275, FSL=0
PID=155400 (hdbscriptserver), PAL=975919863398, AB=2517520384, UA=0, U=1935017743, FSL=0
PID=155403 (hdbstatisticsse), PAL=54217770188, AB=9280462848, UA=0, U=7154416530, FSL=0
PID=103602 (hdbindexserver), PAL=975919863398, AB=153934076384, UA=0, U=938770862704, FSL=0
The statisticsserver may have a smaller process allocation limit than other services and can OOM situations even though the overall memory situation isn’t critical.
The next part of the [MEMORY_OOM] section calculates the ratio of used and allocated memory to determine a heap memory fragmentation. The fragmentation ratio is only relevant if the total unused memory would have been able to satisfy the above memory allocation request.
Example:
Total allocated memory = 368301238272b (349.87gb)
Total used memory = 348492309366b (331.42gb)
Sum AB = 273924309472
Sum Used = 254115380566
Heap memory fragmentation: 8 %
Most relevant in the [MEMORY_OOM] section are two lists of top allocators sorted by inclusive_size_in_use and exclusive_size_in_use, respectively. The first list shows the used memory sizes of allocators including all corresponding sub-allocators. The values of the second list exclude the sizes of any corresponding sub-allocators. In general, only the first few allocators are relevant because they mainly contribute to the overall heap memory consumption.
Example:
Top allocators (ordered descending by inclusive_size_in_use)
1: / 238770862704b (229.24gb)
2: Pool 234475353530b (225.23gb)
3: Pool/RowEngine 70886434400b (66.70gb)
4: Pool/JoinEvaluator 55533801440b (52.40gb)
5: Pool/RowEngine/QueryExecution 52344285928b (49.43gb)
Top allocators (ordered descending by exclusive_size_in_use)
1: Pool/RowEngine/QueryExecution 62344285928b (59.43gb)
2: Pool/JoinEvaluator/JERequestedAttributes/Results44699966400b (41.38gb)
3: Pool/RowEngine/CpbTree 13341134624b (11.56gb)
4: Pool/JoinEvaluator/TranslationTable 122352094344b (10.64gb)
5: Pool/itab 7525826699b (7.07gb)
Usually the exclusive size is more relevant, because it contains the net size of the allocator itself.
The identification of top allocators helps to identify the root cause of the high memory usage, e.g.:
- Expensive queries materializing (intermediate) results.
- Too many or too large loaded tables.
- Too large internal structures or system caches.
- Blocked garbage collection by long-running cursors.
- Too many sessions, connections, transactions, statements.
3. Identification of the responsible threads and connection
Usually several threads collaborate to fulfill a database request. The set of connected threads can be identified via the connection ID (CID). When a thread performs a child activity of another thread, this main thread is referred to as parent. Both CID and parent information can be found and evaluated in certain sections of the OOM dump.
Up to SAP HANA SPS 08 you can determine the connections with the highest memory consumption in the following way. Starting with SAP HANA SPS 09 M_CONTEXT_MEMORY is no longer part of OOM dumps due to the significant overhead involved.
- Extract the M_CONTEXT_MEMORY output in the [STAT] section of the OOM dump into a file and load it into Excel as CSV with semicolon as separator.
- Sort the Excel table by EXCLUSIVE_SIZE_IN_USE.
- Check if the top values for EXCLUSIVE_SIZE_IN_USE are reasonable compared to the overall memory allocation. If they are way too small or much higher then you can’t rely on this information.
- Check the CATEGORY column of the top records. It usually contains the connection (CID) and some further information related to the memory consumption. In the following example we can see that the top memory consumer is connection 226653 and the heap area
Pool/RowEngine/QueryExecution with a total memory utilization of 642 GB:

If the above M_CONTEXT_MEMORY approach is not possible or doesn’t return reliable results, you can have a closer look at the thread that triggered the OOM dump. This thread is sometimes (but not in all cases) responsible for the OOM situation. Checking the “Failed to allocate” size in the [MEMORY_OOM] section can help you to understand the probability that the thread that triggered the OOM dump is also responsible for the high memory consumption:
- If the requested size is extremely high, for example 1844980511408128 byte = 1678 TB, the current thread is definitely responsible for the OOM situation.
- If the requested size has the same order of magnitude as the global allocation limit, for example 512 GB, there is a high probability that the current thread caused the OOM situation.
- If the requested size is smaller than the global allocation limit, for example, a size of a few GB, it is less certain that the current thread actually triggered the OOM and all threads of the OOM trace have to be taken into account.
- If the requested size is much smaller than the global allocation limit, for example a few MB, all threads of the OOM trace have to be examined.
- In some cases, no thread of the OOM trace can be made responsible for the high memory consumption. This may be the case, when result chunks of previous SQL statement executions have not been removed from memory. A continuous growth of one heap memory allocator, for example Pool/ValueArray, may indicate this kind of situation.
If the probability is high that the current thread that caused the OOM situation is responsible for the high memory consumption, search for the string RuntimeDump in the [STACK_SHORT] section. The thread that is currently busy with RuntimeDump is the thread that experienced the OOM situation and wrote the OOM dump. It can be identified in the [thr=] section at the top of the stack trace:
Example:
856177[thr=103882]: JobWrk0131 a
1: 0x00007fb302742657 in Execution::ContextFunctions::printStack(Execution::Context&, ltt::basic_ostream >&, bool)+0x113 at ContextFunctions.cpp:578 (libhdbbasis.so)
2: 0x00007fb30267c2ea in Diagnose::RuntimeDumpSectionStackShort::dump(ltt::basic_ostream >&, Diagnose::RuntimeDumpTimer&, Diagnose::FaultDescriptor*)+0xc6 at CrashDump.cpp:926 (libhdbbasis.so)
3: 0x00007fb302675258 in Diagnose::CrashDump::executeInternal(ltt::basic_ostream >&, Diagnose::FaultDescriptor*, Diagnose::LocalRuntimeDumpSection**, unsigned long, Diagnose::RuntimeDumpFilter const*)+0x984 at CrashDump.cpp:531 (libhdbbasis.so)
Be aware that the information at the end of the [STAT] starting with “Some information about current context” is not useful to check the thread that hit the OOM situation, because the displayed data is for the whole process (e.g. “indexserver”).
When you have identified a thread and / or connection you can check in the [THREADS] section of the OOM dump for further details like related user names, the application name, the thread status, query plan, related objects and coding details. When you have determined the related connection ID (CID) you can look for other threads that are connected to the same connection ID:
Example:
856177[thr=103882]: JobWrk0131, TID: 53, UTID: -1, CID: 240284, parent: 123472, SQLUserName: "SOLMAN_CONSISTENT_READ", AppUserName: "MUELLER", AppName: "", type: "Generic", method: "empty-run", detail: "", command: "" at 0x00007fb302742c0b in Execution::ContextFunctions::printProgramCounter(Execution::Context&, ltt::basic_ostream >&)+0x1b at ContextFunctions.cpp:793 (libhdbbasis.so)
1144154[thr=104527]: SqlExecutor, TID: 53, UTID: -1, CID: 240284, parent: ---, SQLUserName: "SOLMAN_CONSISTENT_READ", AppUserName: "MUELLER", AppName: "", type: "SqlExecutor", method: "", detail: "", command: "
{
SQL: SELECT source1.ITEM_ID, source1.STORE_ID, …
QUERY PLAN:
|OPERATOR_NAME|OPERATOR_DETAILS|EXECUTION_ENGINE|SCHEMA_NAME|TABLE_...
RELATED OBJECTS:
-TABLE:SAPSR3.INVOICE(saphana1:31003)
-USER:SOLMAN_CONSISTENT_READ
-PROXY_TABLE:SAPSR3.SMART_ACCESS_CH1_INVOICE
STATEMENT-TRANSTOKEN: Newdb::TransToken CONTENTS - 0x00007f868d638000 [ tid = -8385945 row_cid = 0 col_cid = 0 stmt_seq = 1 parent = 0x00007f85cea75a00 master_token = 0x00007f85cea75a00 ddl_token = 0x0000000000000000 snapshot_token = 0x00007f90301d8100 master_trans_id = -1 master_trans_wm = 0 trans = 0x00007f8746e2b000 stmt = 0x00007f88d617b800 isoLevel = 1 trans_lock_timeout = -1 } / TransactionManager::TransToken CONTENTS - 0x00007f90301d8100 [ TID: 8385945, CTS: 77037195, BaseTID: 8385944, MetaTS: 1471, CV: 0x00007f8848111f00, TransCV: 0x0000000000000000, Trans: 0x0000000000000000, TIDTracker: 0x00007f9b1af60ec0 ]
TRANSACTION-TRANSTOKEN: Newdb::TransToken CONTENTS - 0x00007f85cea75a00 [ tid = -8385945 row_cid = 0 col_cid = 0 stmt_seq = 0 parent = 0x0000000000000000 master_token = 0x00007f85cea75a00 ddl_token = 0x0000000000000000 snapshot_token = 0x0000000000000000 master_trans_id = 53 master_trans_wm = 6593622 trans = 0x00007f8746e2b000 stmt = 0x0000000000000000 isoLevel = 1 trans_lock_timeout = -1 }
}
" at 0x00007fb2ef53e2a9 in syscall+0x19 (libc.so.6)
The overview of memory areas for the determined connection can subsequently be checked in the M_CONTEXT_MEMORY information in the [STAT] section of the dump (load it as CSV file into Excel as described before).
Example:
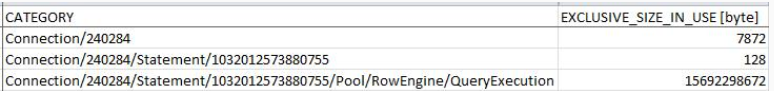
4. Identification of responsible SQL statements
Optimally you were able to determine a responsible thread and connection and you already found the linked SQL statements that are responsible for the high memory consumption.
If a responsible thread and connection is not clear, you can have a look at all SQL statements that are documented in the dump file.
Check via SQL: "HANA_Threads_ThreadSamples_FilterAndAggregation" which SQL statements were active for some time before the OOM dump happened. Typically longer running SQL statements impose a higher risk of OOM situations.
If you have activated memory tracking and the expensive statement trace as described in SAP Note 1999997 ("Is it possible to monitor the memory consumption of SQL statements?"), you can use SQL: "HANA_SQL_ExpensiveStatements" (SAP Note 1969700) to check for SQL statements with a particularly high memory consumption around the time of the OOM dump.
If you have no idea which SQL command may be responsible for the high memory consumption, sort the SQL commands by their complexity of the execution plan. The amount of operators in a plan is a rough – not necessarily correct – indication for the plan complexity.
When the top allocators are well known, you can apply additional filters to search for a potential culprit command:
When allocator Pool/parallel is a large memory consumer, search for the expressions AGGREGATION or OLAP.
If the size of allocator Pool/JoinEvaluator, Pool/IndexVectorAligned, Pool/DocidValueArray or one of their sub-allocators is very large, search for the uppercase term JOIN.
If the size of allocator Pool/itab dominates the heap memory, search for expression COLUMN SEARCH.
If allocator Pool/ValueArray is most prominent, search for join queries. In some cases, the join queries that caused the OOM situation have already terminated and their result chunks still reside in memory, waiting to be fetched from the client application.
5. Further troubleshooting steps
If you have determined the critical memory consumers (thread, connection, heap area, SQL statement) but you are not able to understand the root cause, you can have a look at SAP Note 1999997 that contains further details for memory troubleshooting.